
Features
Everything you need to see your whole portfolio.
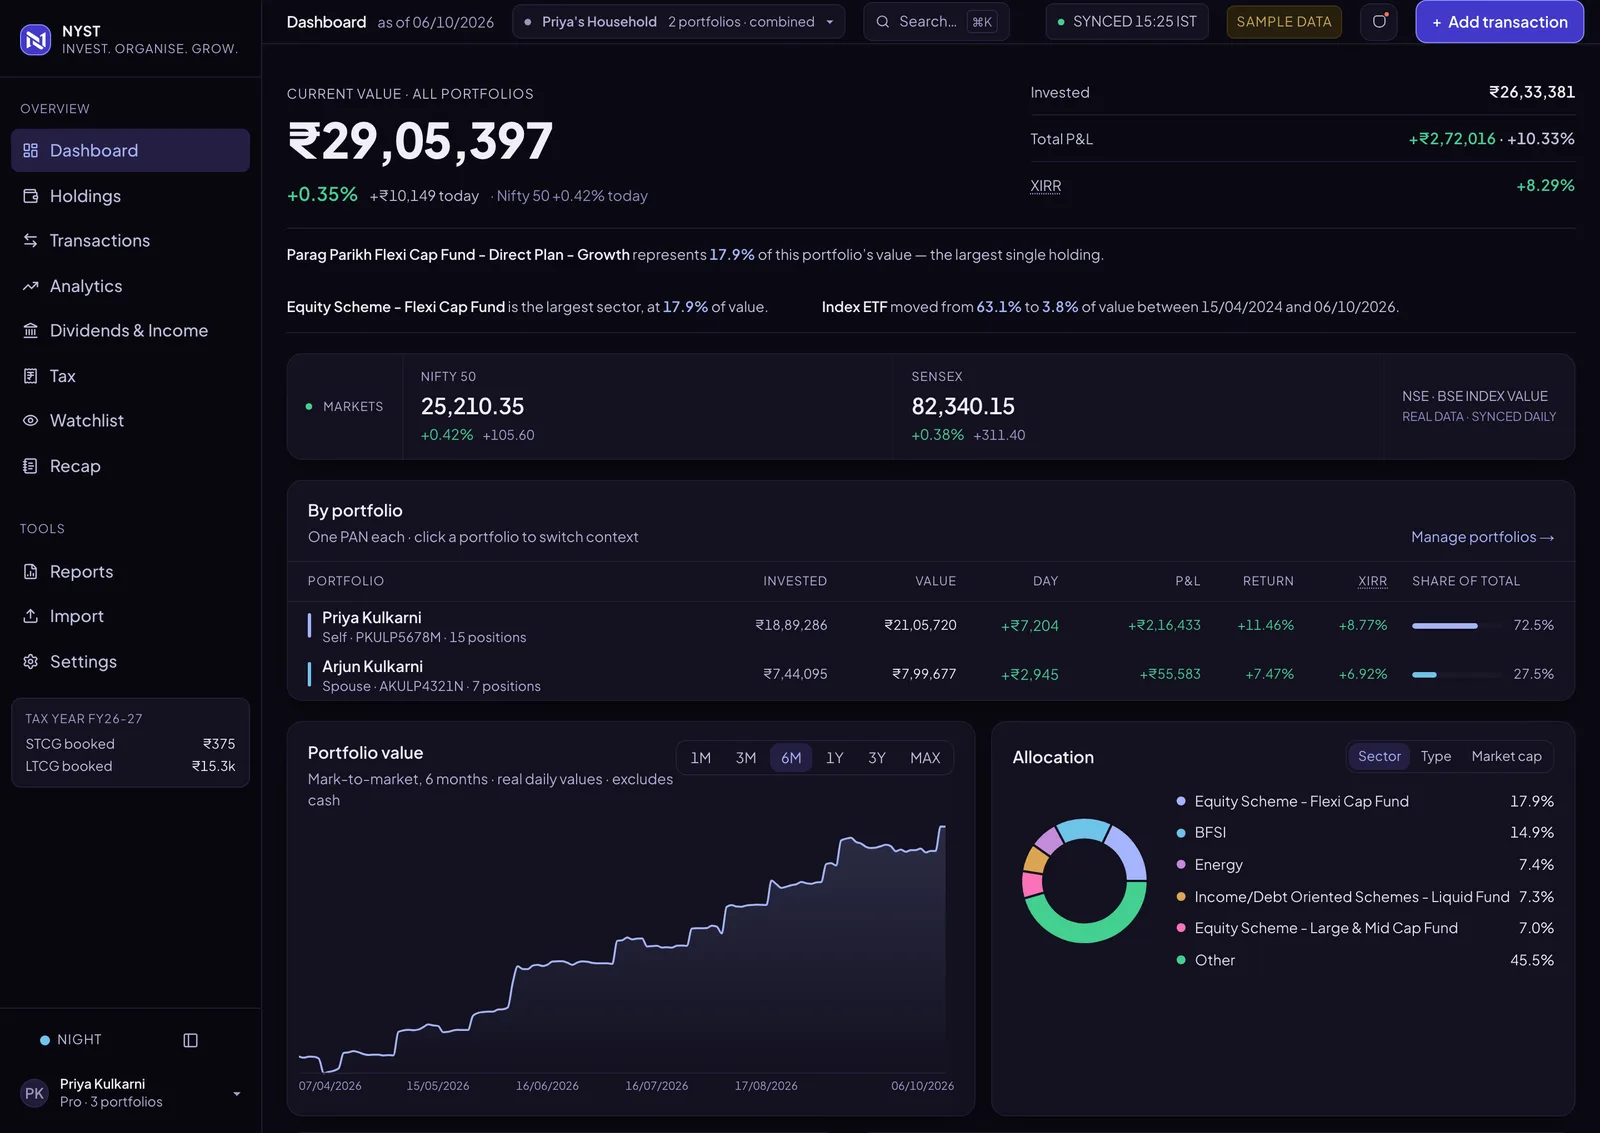
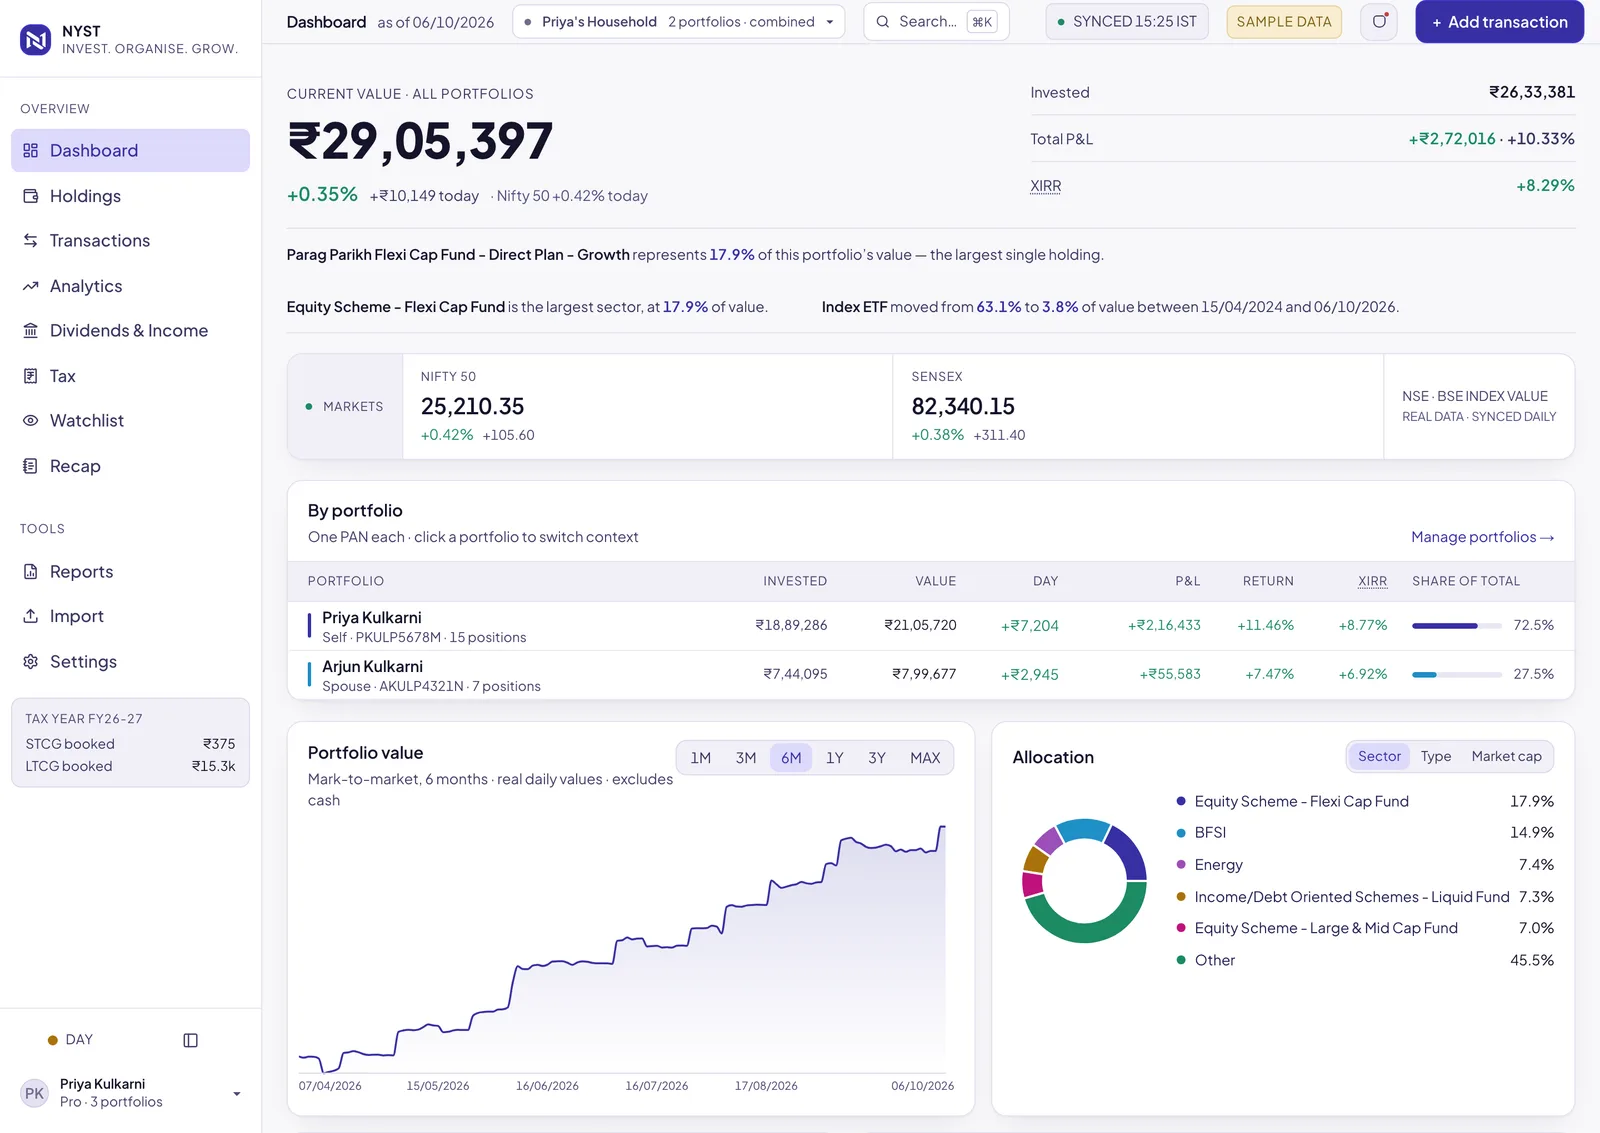
One view of everything you own
Your value today, what you have invested, profit and loss, and how you are doing against the market, all on one screen.
- Total value, daily change and money-weighted return (XIRR)
- Nifty 50 and Sensex alongside your own numbers
- A value chart and allocation by sector, asset type or market cap
- Each portfolio compared side by side
Every holding, in detail
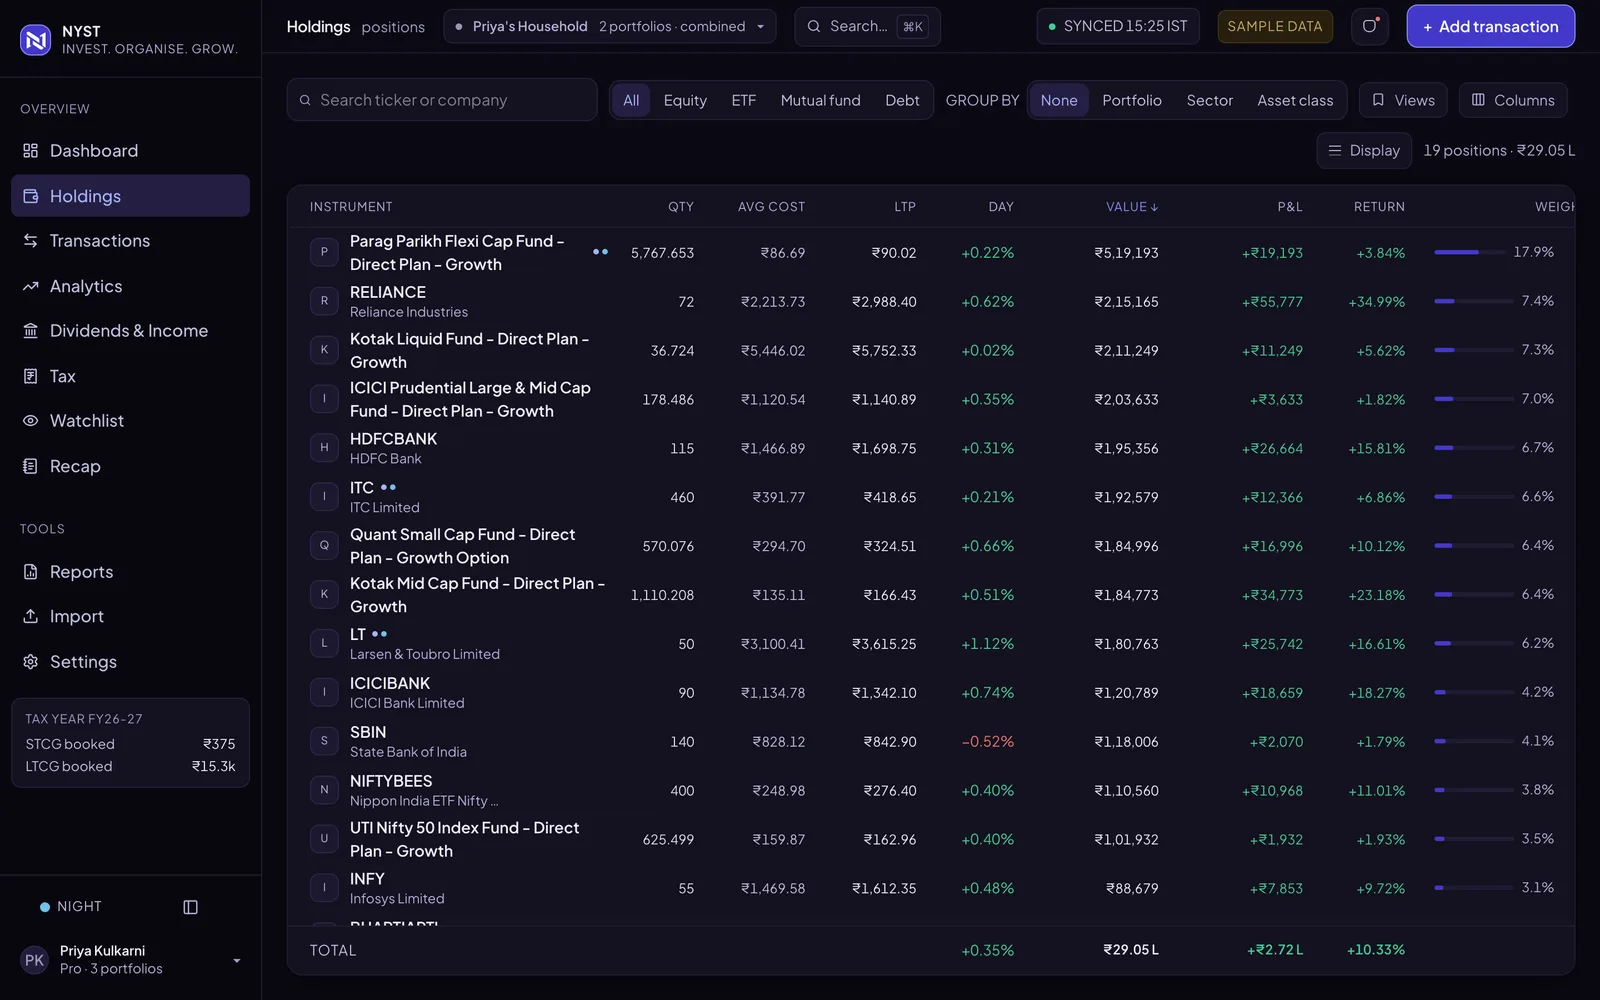
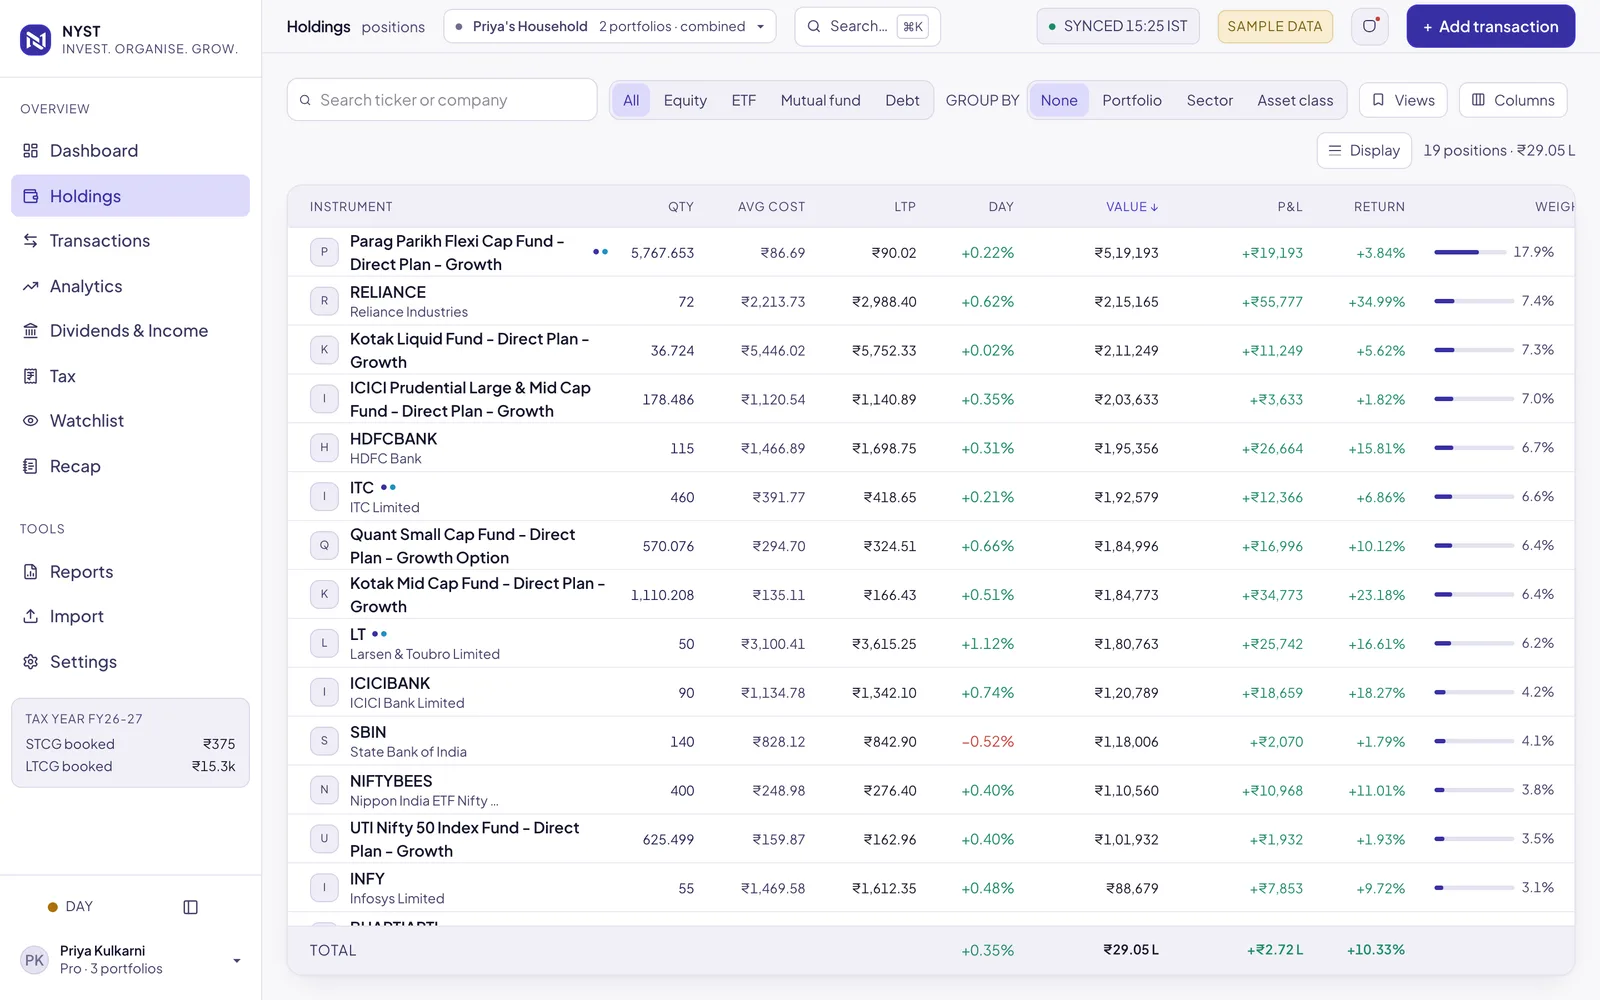
Stocks, ETFs and mutual funds in one table, with the numbers that matter for each position.
- Quantity, average cost, current price, day change, value, profit and loss, and weight
- Filter by equity, ETF, mutual fund or debt
- Group by portfolio, sector or asset class
- Save your own views and choose your own columns
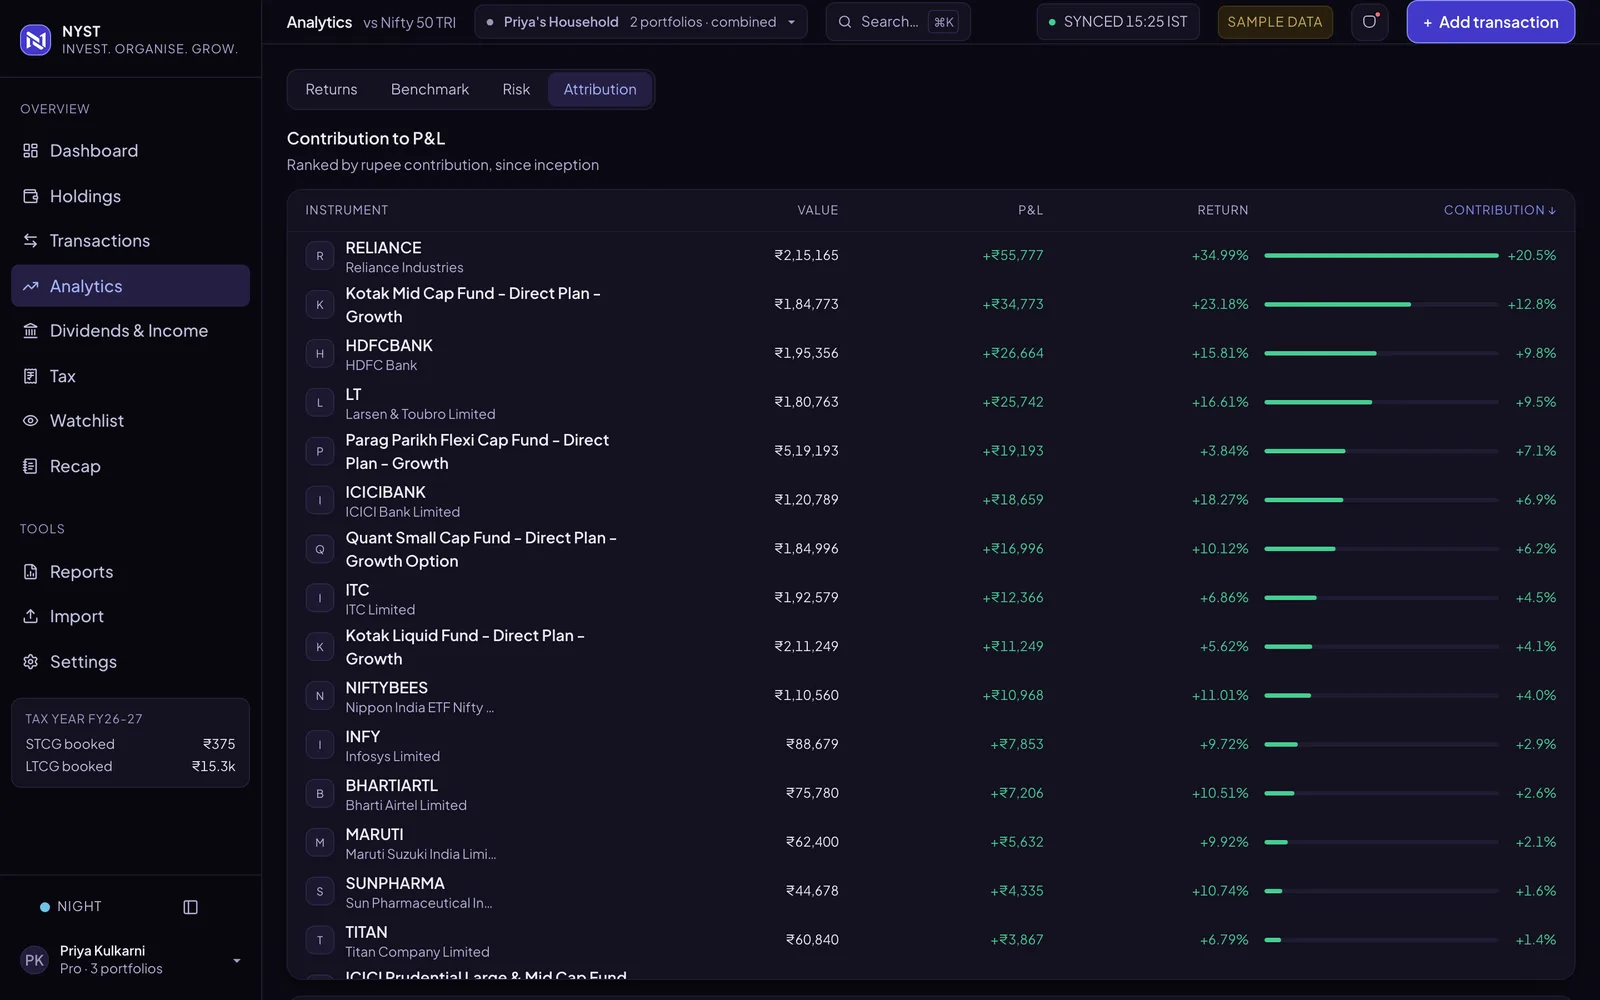
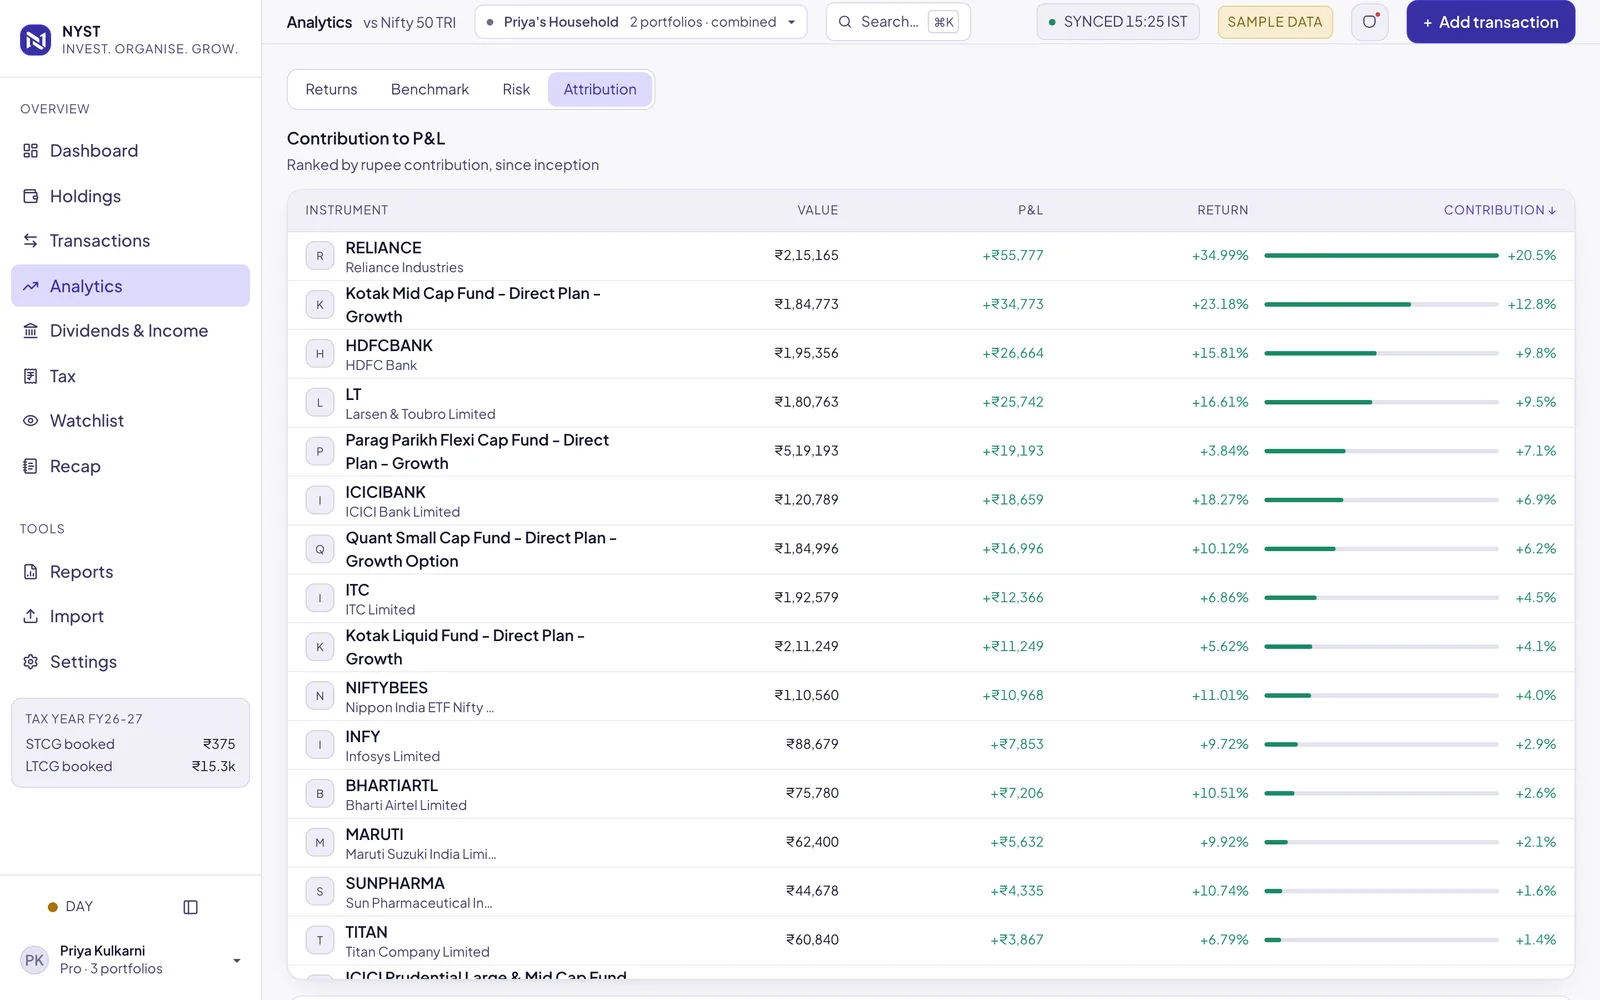
See what is driving your returns
Know which holdings made you money and how much each one contributed, instead of guessing from the total.
- Contribution to profit and loss, ranked by rupee impact
- Returns that account for when you invested
- Realised and unrealised gains separated
- Benchmark and risk views
Dividends and income, tracked
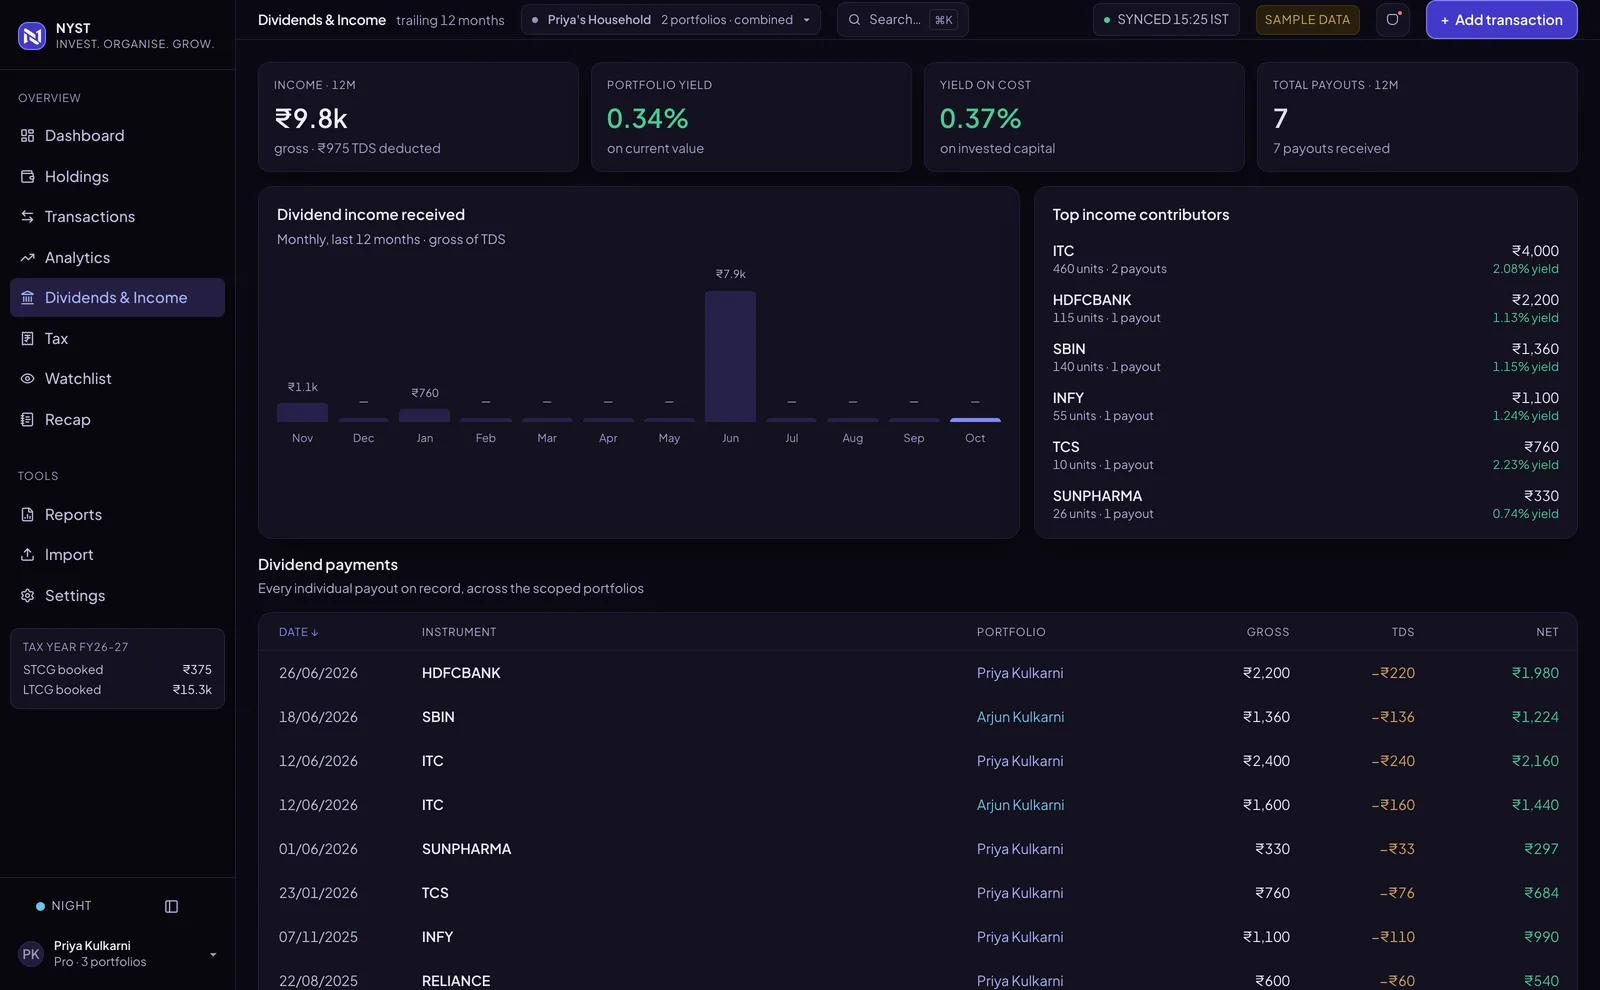
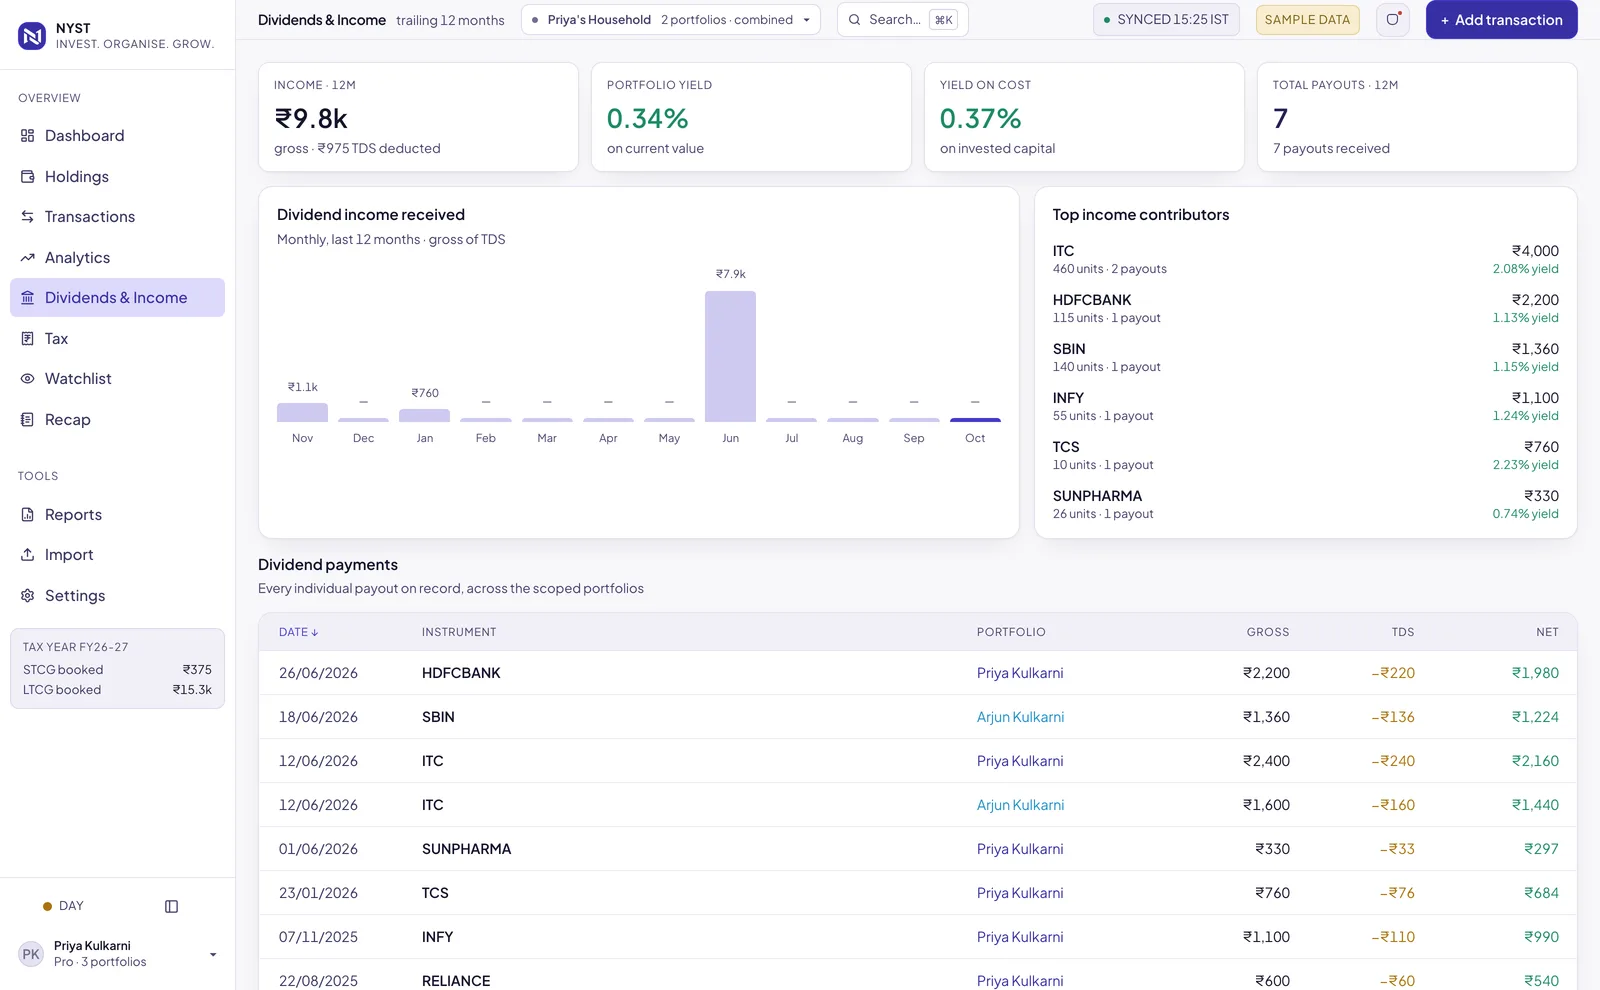
Every payout on record, with yield and tax deducted, so income does not get lost in a statement.
- Monthly dividend income for the last 12 months
- Top contributors, with yield on current value and on cost
- Gross, tax deducted at source and net for each payout
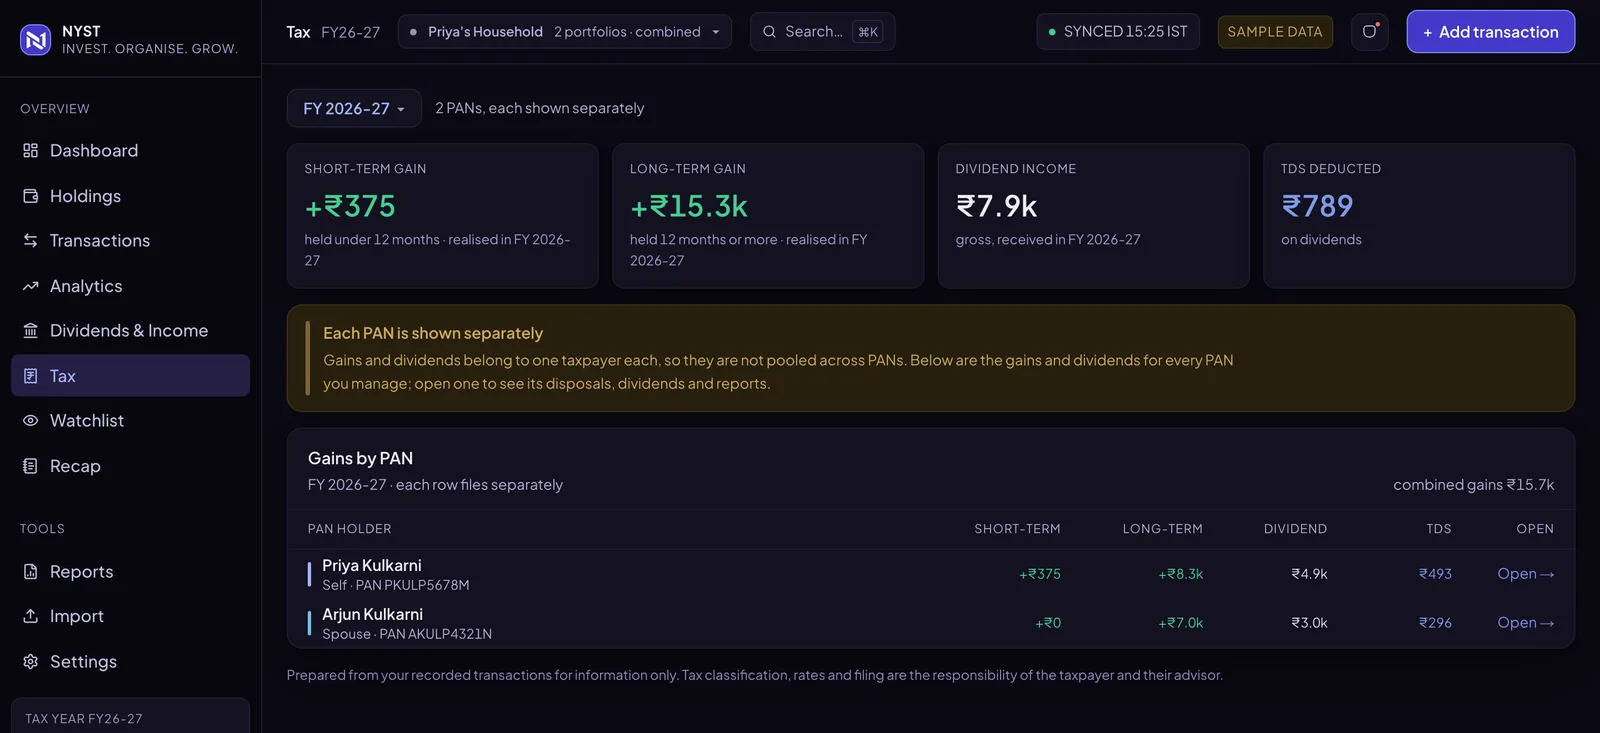
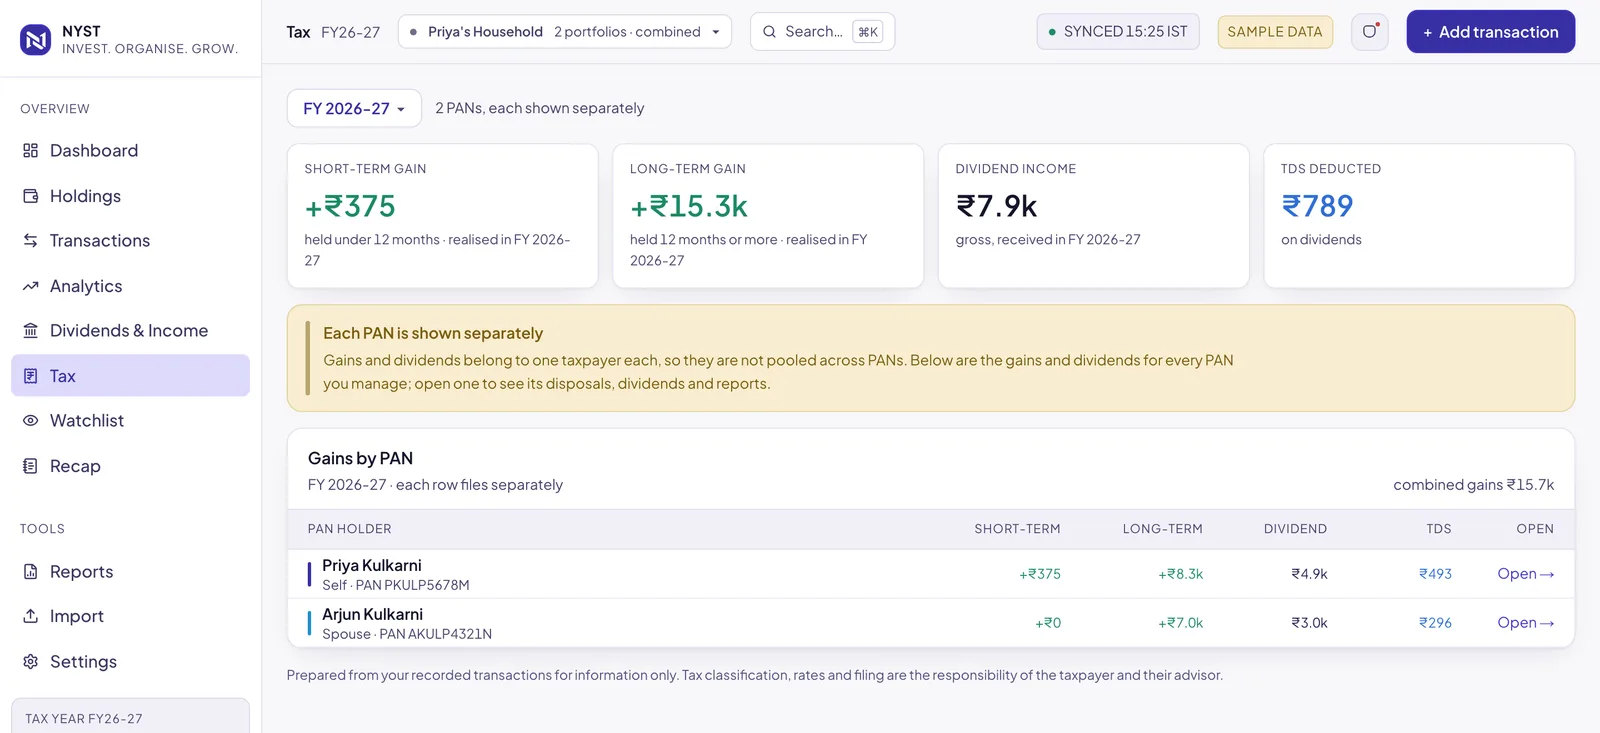
Capital gains, ready by financial year
Short-term and long-term gains worked out from your own transactions, one taxpayer at a time.
- Short-term and long-term gains for each financial year
- Dividend income and tax deducted
- Each PAN shown separately, so family members are never mixed together
Import, don’t retype
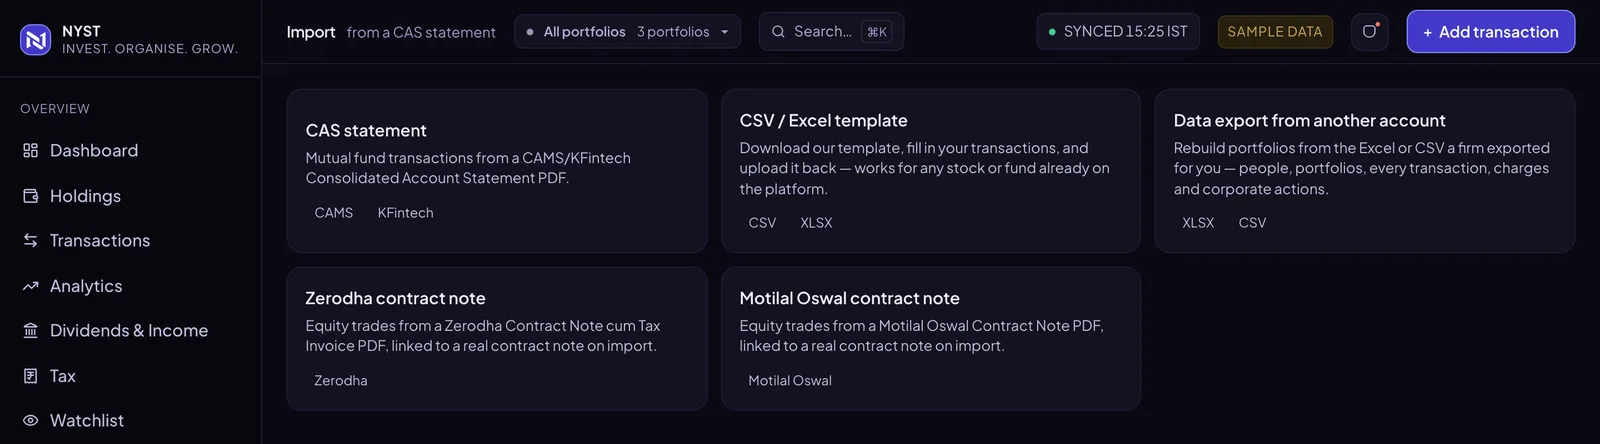
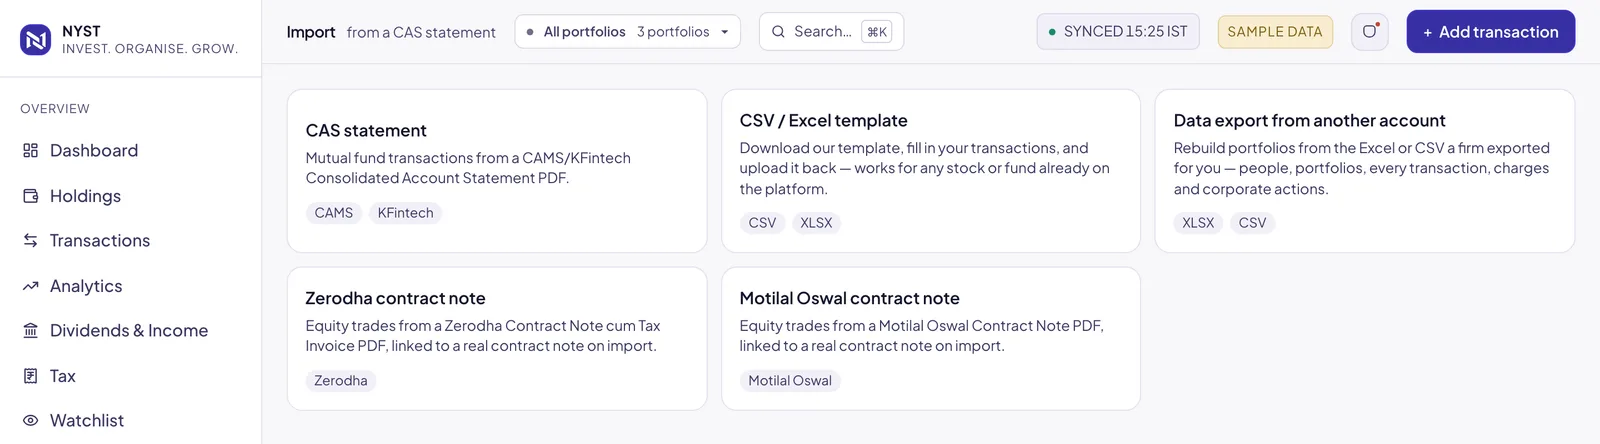
Bring in what you already have from the sources Indian investors actually use.
- Mutual fund statements (CAS) from CAMS and KFintech
- Contract notes from Zerodha and Motilal Oswal
- A CSV or Excel template for anything else
- Rebuild portfolios from a data export from another account
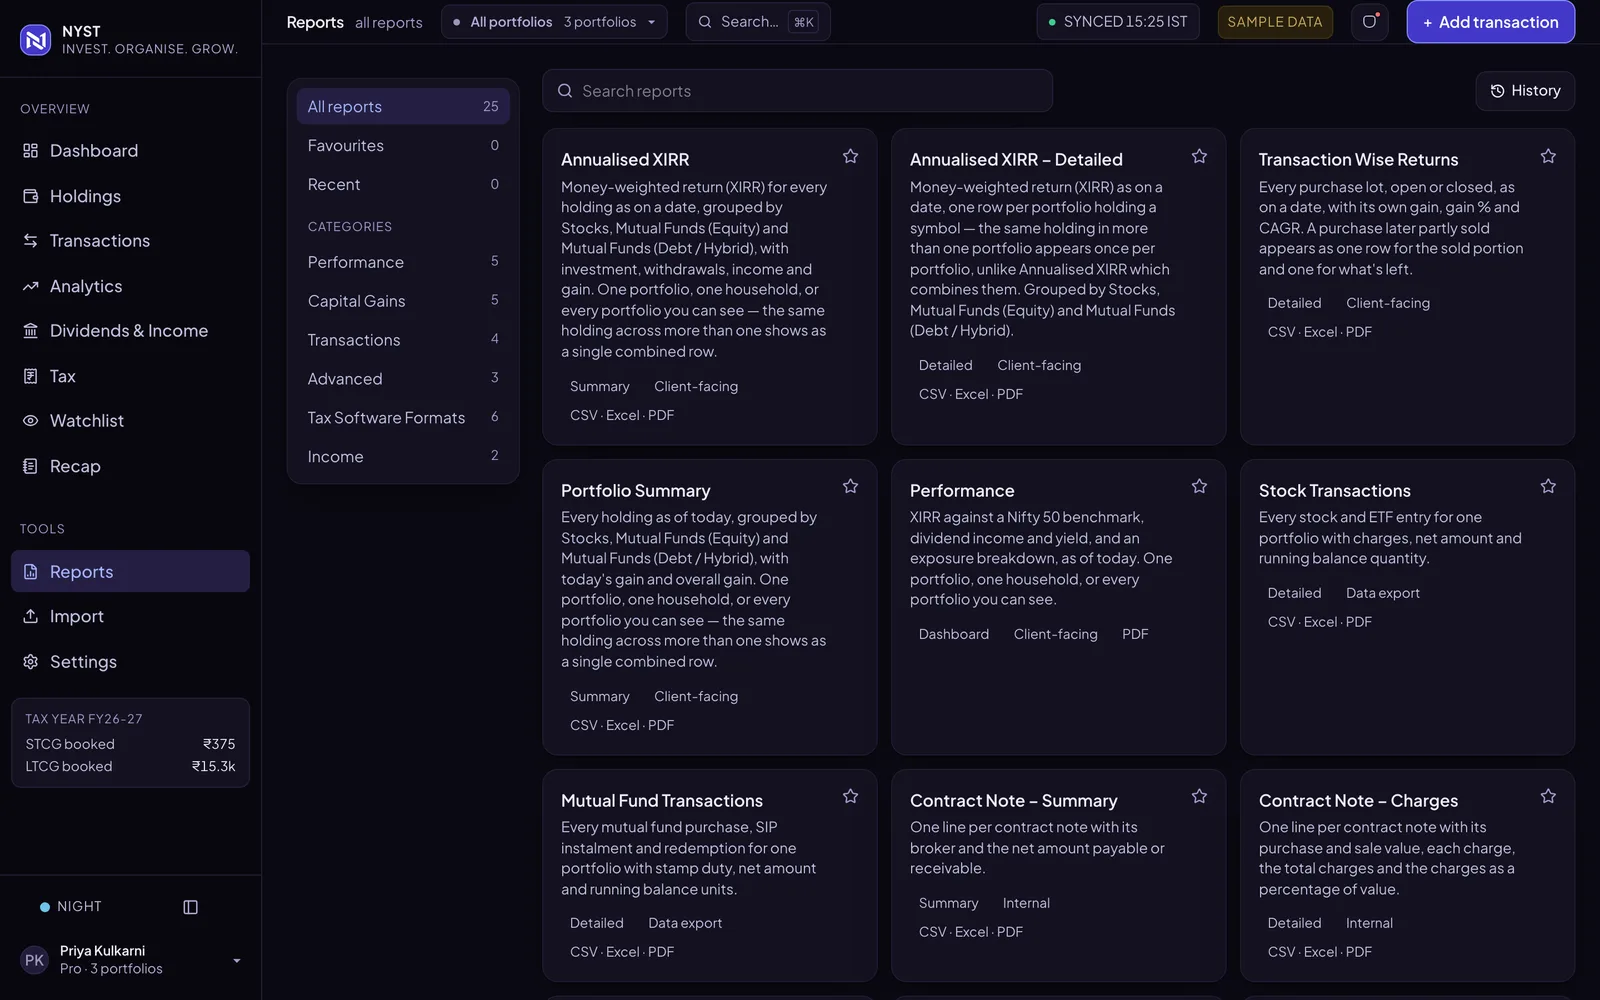
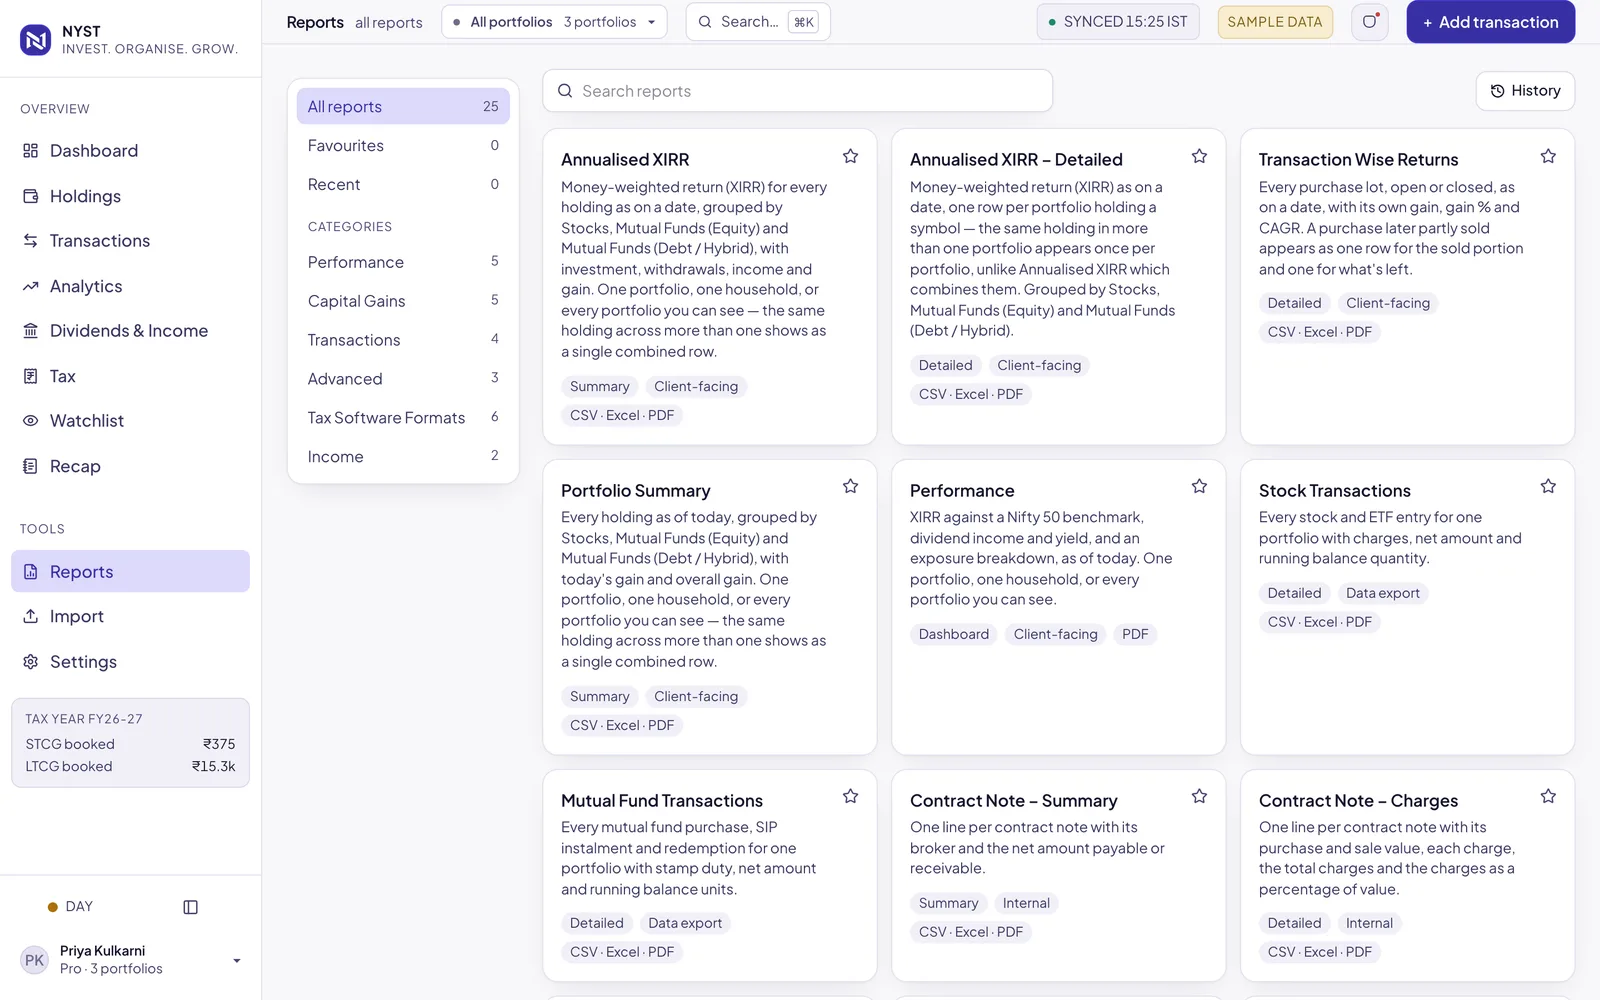
Reports you can hand to anyone
A library of ready-made reports for you, your accountant or your clients.
- 25 reports across performance, capital gains, transactions, income and more
- Download as CSV, Excel or PDF
- Client-facing versions for advisors
- Formats for tax software
And more
Recap and watchlist
A periodic recap of what changed, and a watchlist for instruments you are following.
Families and clients
Organise holdings across multiple portfolios and people, with access you control.
Two-factor sign-in
Protect your account with an authenticator app and backup codes.